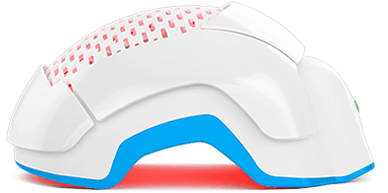
| Start Date | Location | No of Users/Patients | No of Weeks | Type of Study | Product | Photo | Video | Outcome/Success Rate |
|---|---|---|---|---|---|---|---|---|
| Q1 2011 | San Francisco | 30 | 24 | Women’s Study | PRO |
|
|
100% saw improvements |
| Q2 2012 | San Francisco | 31 | 2 | Women Usability and Comprehension Study | PRO |
|
|
99.9% confidence and zero failures |
| Q3 2015 | California, Georgia, Oregon, Tennessee | 56 | 26 | Men Clinical Study(randomize, double-blind, multi-center and sham control) | PRO |
|
|
98% saw improvements |
| Q4 2017 | Pennsylvania | 24 | 22 | Women User Group | EVO |
|
|
100% saw improvements |
| Q1 2018 | Pennsylvania | 12 | 26 | Men User Group | EVO |
|
|
100% saw improvements |
| Q1 2018 | Pennsylvania | 12 | 26 | Men User Group | PRO |
|
|
100% saw improvements |
| Q4 2018 | San Francisco | 24 | 26 | Men & Women PRO User Group | PRO |
|
|
100% saw improvements |
| Q4 2018 | Los Angeles | 24 | 26 | Men & Women User Group | EVO |
|
|
100% saw improvements |
Still unsure? Reach out to us.
Speak with one of our hair loss specialists today or ask for free consultation as per your convenience. Fill the consultation form, and receive a personalized consultation — free of charge.
The Theradome® Hair Helmet Provides Next-Generation, Clinical Strength Laser Hair Technology for Safe, Effective Laser Hair Regrowth Treatments at Home

